


 6 / 90

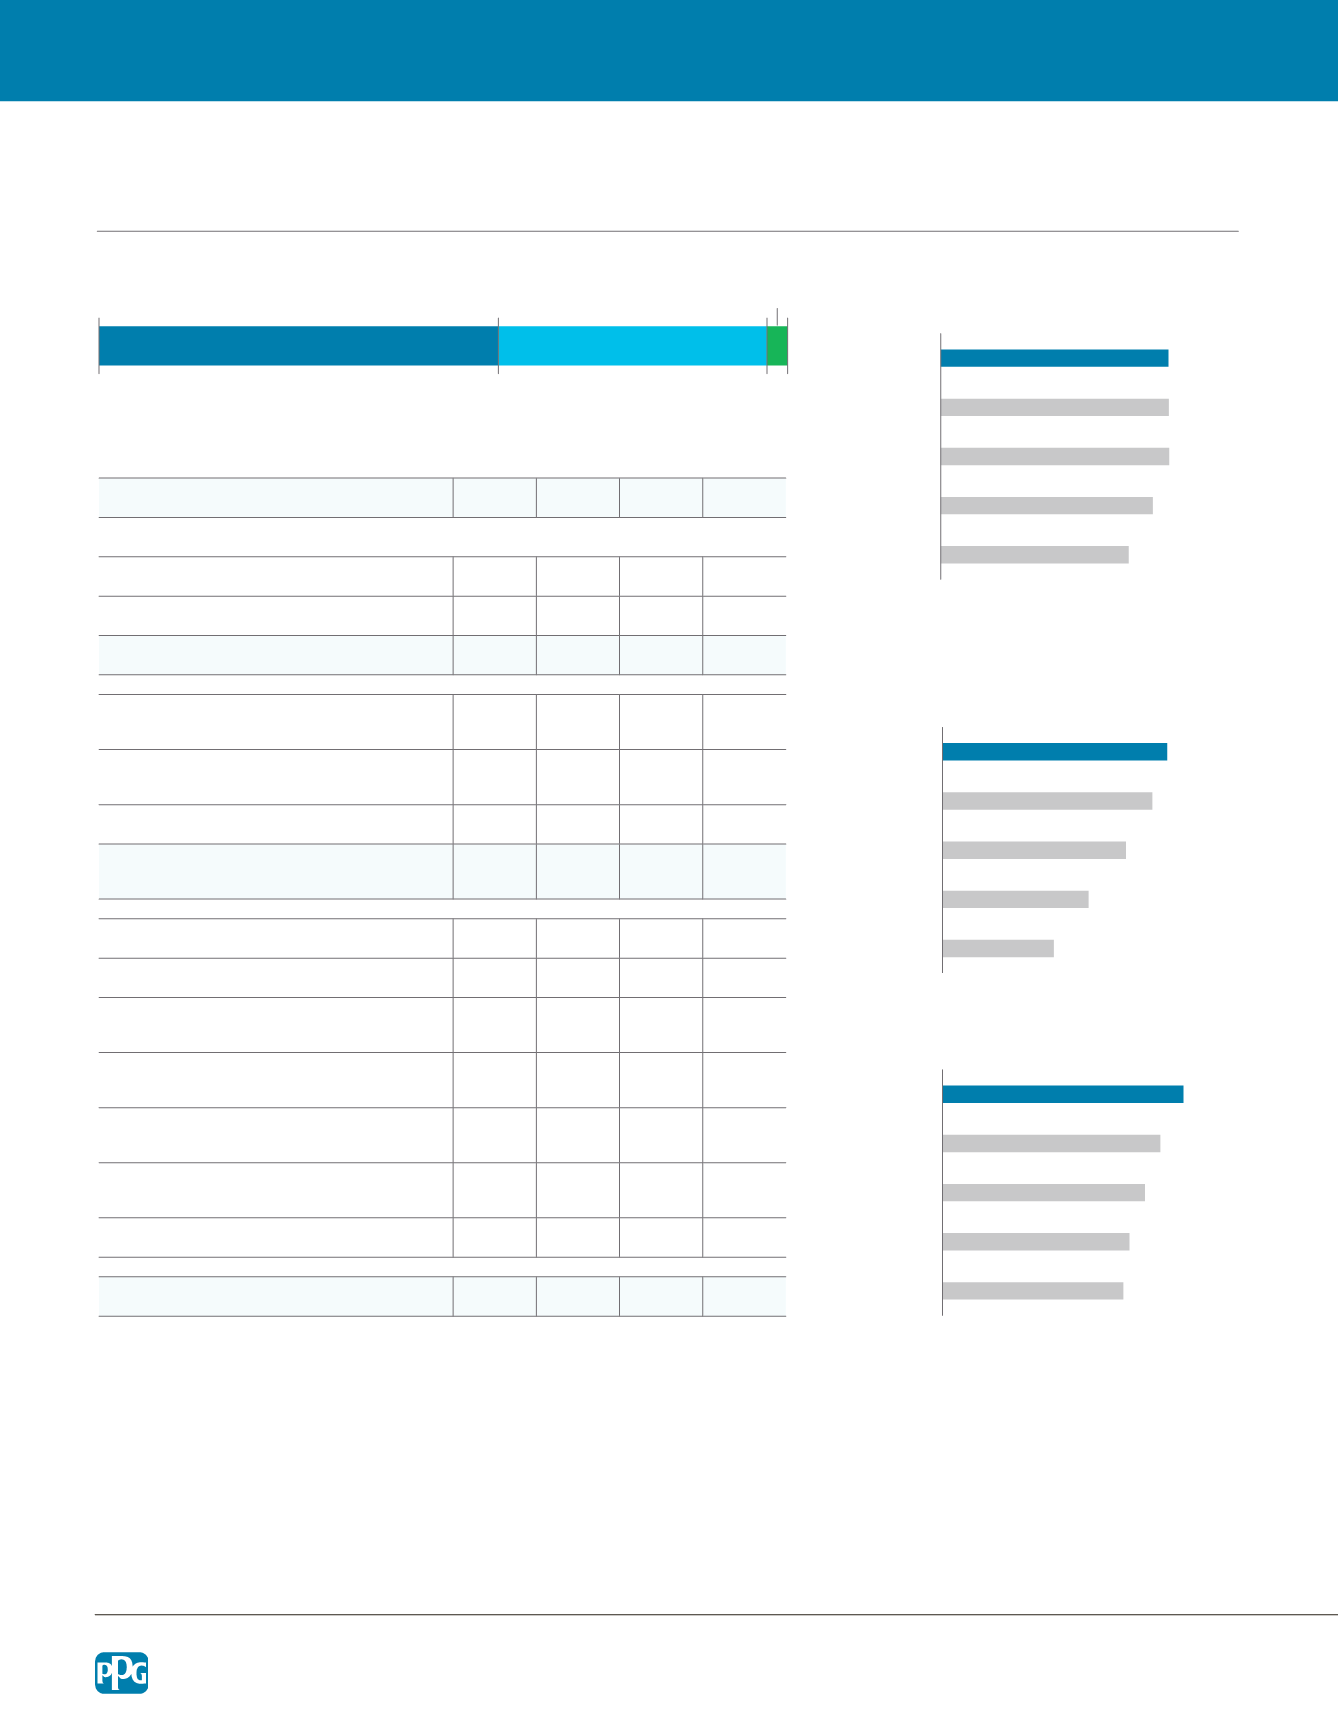
2016 Financial Overview and Shareholder Information
$12,169
$13,736
$14,791
$14,766
$14,751
2012
2013
2014
2015
2016
$2.88
$3.78
$4.75
$5.43
$5.82
2012
2013
2014
2015
2016
$1.17
$1.21
$1.31
$1.41
$1.56
2012
2013
2014
2015
2016
1 Net income from continuing operations, earnings per diluted share from continuing operations and return on average capital decreased year-over-year primarily due to pension settlement
charges of $616 million (after-tax) or $2.31 per diluted share recorded in conjunction with the transfer of certain U.S. and Canadian pension benefit obligations and assets to several highly rated
insurance companies; as well as a net tax charge of $151 million or $0.57 per diluted share associated with the funding of the Pittsburgh Corning asbestos settlement trust.
2 Includes an after tax gain of $267 million or $1.01 per diluted share resulting from the sale of our flat glass business in 2016.
3 Adjusted amounts in 2016, 2015 and 2014 exclude after tax net charges of $3.71, $0.54 and $0.87, respectively, which are included in reported earnings per diluted share. For detailed
information regarding these adjustments, see the Regulation G Reconciliation in Item 7 of the Form 10-K. Adjusted amounts in 2013 exclude per diluted share amounts of $0.25 for business
restructuring; $0.22 for environmental remediation; $0.08 for transaction-related costs; and $0.04 for legacy pension settlement charges. The adjusted amounts are reduced by $0.03 for the
retroactive benefit of a U.S. tax law change. Adjusted amounts in 2012 exclude per diluted share amounts of $0.45 for business restructuring; $0.32 for environmental remediation; and $0.02
for transaction-related costs.
4 On April 16, 2015, the PPG Board of Directors approved a 2-for-1 split of the company's common stock. PPG common stock began trading on a split-adjusted basis on June 15, 2015.
All historical per share and share data give retroactive effect to the 2-for-1 stock split.
5 Operating cash flows from continuing operations decreased year-over-year primarily due to the Company fully satisfying its funding obligation to the Pittsburgh Corning asbestos settlement
trust of approximately $800 million (pre-tax) or approximately $630 million (after-tax).
2016 2015
$
Change
%
Change
Net sales
$ 14,751 $14,766 $ (15)
0%
Net Income (attributable to PPG)
Income from continuing operations
1
$ 564 $ 1,338 $ (774)
(58%)
Income from discontinued operations
2
$ 313 $
68 $ 245
360%
Net income
1, 2
$ 877 $ 1,406 $ (529)
(38%)
Earnings per diluted share from
continuing operations
1
$ 2.11 $ 4.89 $ (2.78)
(57%)
Earnings per diluted share from
discontinued operations
2
$ 1.17 $ 0.25 $ 0.92
368%
Total earnings per diluted share
$ 3.28 $ 5.14 $ (1.86)
(36%)
Adjusted earnings per diluted share
from continuing operations
3
$ 5.82 $ 5.43 $ 0.39
7%
Dividends per share
$ 1.56 $ 1.41 $ 0.15
11%
Return on average capital
1
7.0% 15.7% (8.7%)
(55%)
Operating cash flow
(from continuing operations)
5
$ 1,241 $ 1,735 $ (494)
(28%)
Capital spending (from continuing
operations including business acquisitions)
$ 751 $ 774 $ (23)
(3%)
Research and development
(from continuing operations)
$ 487 $ 494 $
(7)
(1%)
Average shares outstanding —
assuming dilution
267.4
273.6
(6.2)
(2%)
Average number of employees
47,000 46,600
400
1%
PPG shareholders' equity
$ 4,826 $ 4,983 $ (157)
(3%)
Net Sales ($ MM)
from continuing operations
Financial Overview
Net Sales by Reportable Segment
Adjusted Earnings per
Diluted Share
3, 4
from continuing operations
Dividends per Share
4
Performance Coatings 58%
Glass 3%
Industrial Coatings 39%
PPG ANNUAL REPORT AND FORM
K