


 7 / 90

2016
2015
4
Quarter Ended
High
Low Close High
Low Close
31-Mar
$
112.10 $
88.37 $ 111.49 $ 118.95 $ 109.91 $
112.77
30-Jun
$
117.00 $
98.08 $ 104.15 $ 117.48 $ 110.33 $ 114.72
30-Sep
$ 110.14 $
99.78 $ 103.36 $ 118.27 $ 84.40 $
87.69
31-Dec
$ 104.08 $
89.64 $ 94.76 $ 106.87 $
82.93 $
98.82
2016
2015
4
Month of Payment
Amount ($ MM)
Per Share Amount ($ MM)
Per Share
March
$
96 $
0.36 $
91 $
0.33
June
$
107 $
0.40 $
98 $
0.36
September
$
106 $
0.40 $
97 $
0.36
December
$
105 $
0.40 $
97 $
0.36
TOTAL
$
414 $
1.56 $
383 $
1.41
Quarterly Stock Market Price
Shareholder Information
Shareholder Return Performance
Dividends
PPG has paid uninterrupted annual
dividends since 1899. The latest
quarterly dividend of 40 cents per
share was approved by the board of
directors on January 19, 2017, payable
March 10, 2017 to shareholders of
record February 17, 2017.
The number of holders of record of
PPG common stock as of January
31, 2017 was 14,048 as shown
on the records of the Company’s
transfer agent.
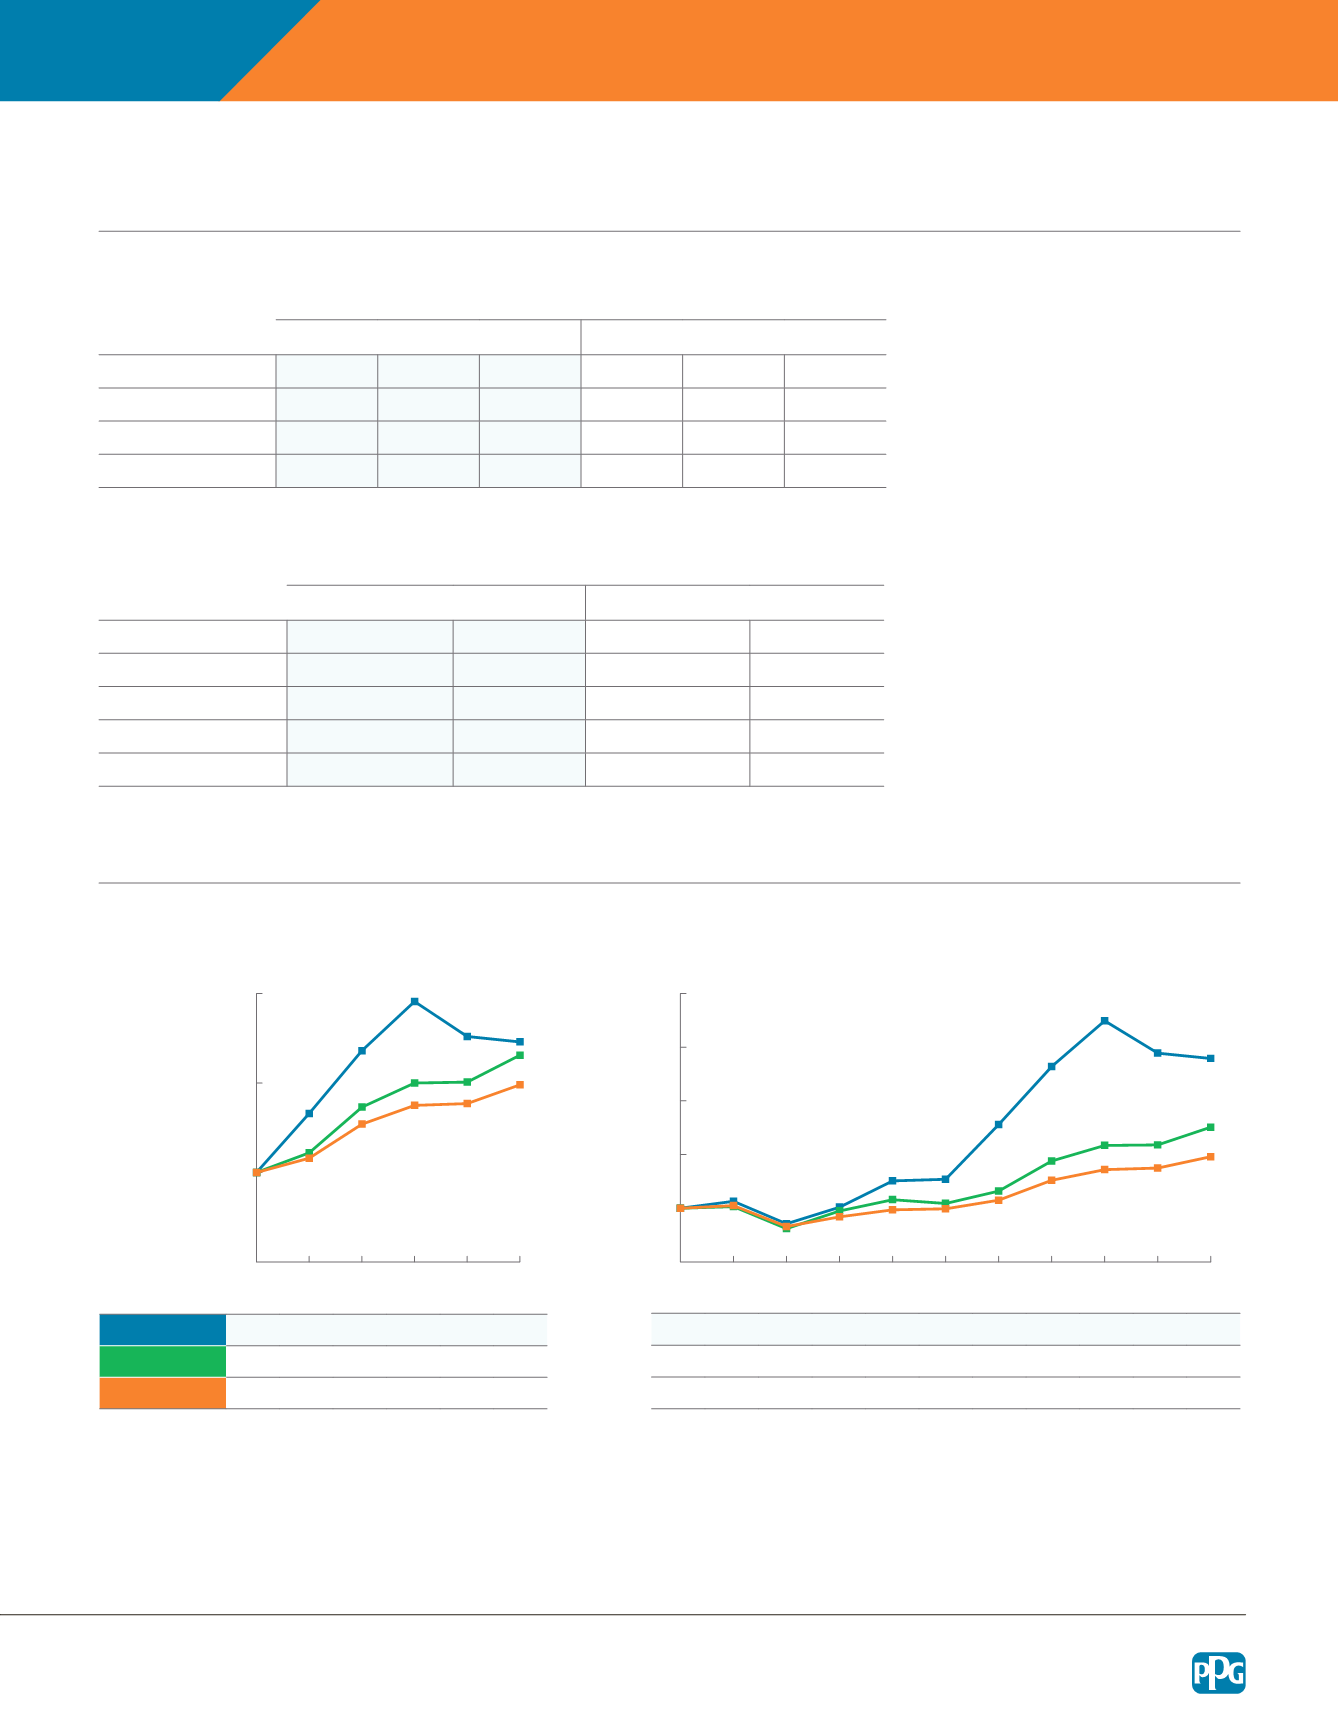
These line graphs compare the yearly percentage changes in the cumulative total shareholder value return of the company’s common stock with the cumulative total return of the Standard &
Poor’s Composite 500 Stock Index (“S&P 500 Index”) and a defined Peer Group, for the five-year and ten-year periods beginning Dec. 31, 2011, and Dec. 31, 2006, respectively, and ending Dec. 31,
2016. The information presented in these graphs assumes that the investment in the company’s common stock and each index was $100 on Dec. 31, 2011 and Dec. 31, 2006 and that all dividends
were reinvested. The Peer Group includes, AkzoNobel N.V., The Dow Chemical Co., Eastman Chemical Co., E.I. DuPont de Nemours & Co., Masco Corp., RPM International Inc., The 3M Company,
The Sherwin-Williams Co. and The Valspar Corp. The 3M Company was a member of the Peer Group included in the company’s 2015 annual report; however, the notes to the graphs inadvertently
excluded The 3M Company from the list of peer group members.
Comparison of Five-Year Cumulative Total Return
Comparison of Ten-Year Cumulative Total Return
'11 '12 '13 '14 '15 '16
PPG
$ 100 $ 116 $236 $ 291 $ 252 $ 246
Peer Group
$ 100 $ 122 $ 173 $200 $ 201 $ 231
S&P 500
$ 100 $ 116 $ 154 $ 175 $ 177 $ 198
'06 '07 '08 '09 '10 '11 '12 '13 '14 '15 '16
$ 100 $ 113 $ 71 $ 102 $ 151 $ 154 $256 $364 $449 $389 $379
$ 100 $ 103 $ 62 $ 95 $ 116 $ 109 $ 132 $ 188 $ 217 $ 218 $ 251
$ 100 $ 105 $ 66 $ 84 $ 97 $ 99 $ 115 $ 52 $ 172 $ 175 $ 196
$0
$100
$200
$300
$400
$500
06 07 08 09 10 11
12 13 14 15 16
$0
$100
$200
$300
11
12 13 14 15 16
PPG ANNUAL REPORT AND FORM
K